|
APRIL 22, 2013 |
The two pictures below present a quick visual summary of how what distinguishes human hand shape from the proportions seen in other primate species. |
|
APRIL 22, 2013 |
The two pictures below present a quick visual summary of how what distinguishes human hand shape from the proportions seen in other primate species. |
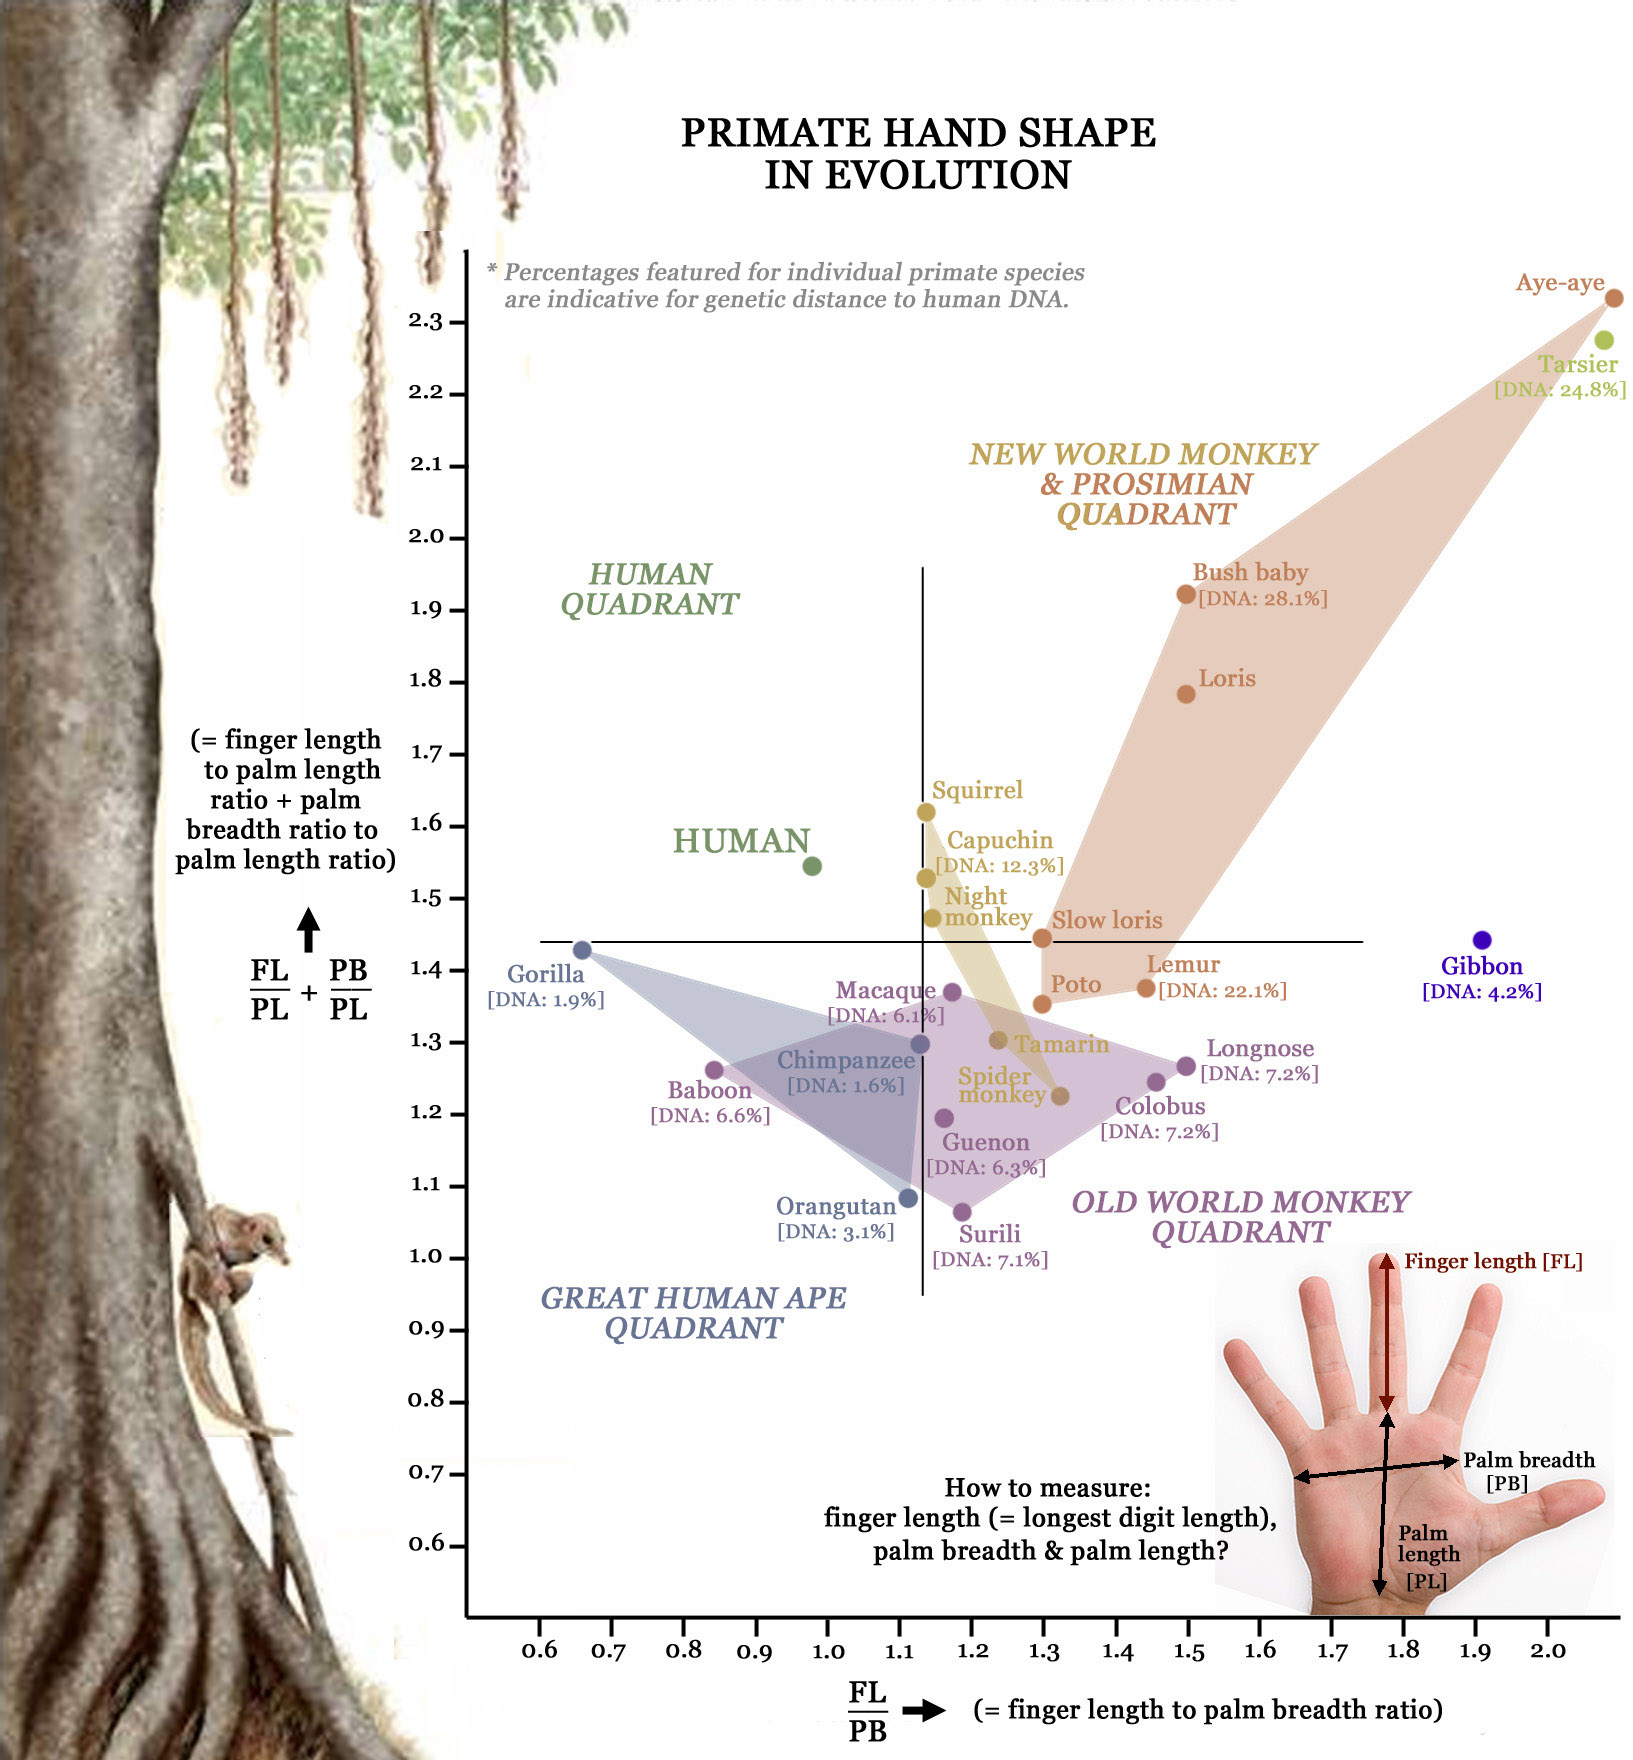
| The 3 ratios between these three aspects then represent the major key-aspects of the hand shape; where the most interesting results are found when the finger length to palm breadth ratio [= fl/pb] is plotted against the summary of finger length to palm length [fl/pl] + palm breadth to palm length [pb/pl]. |
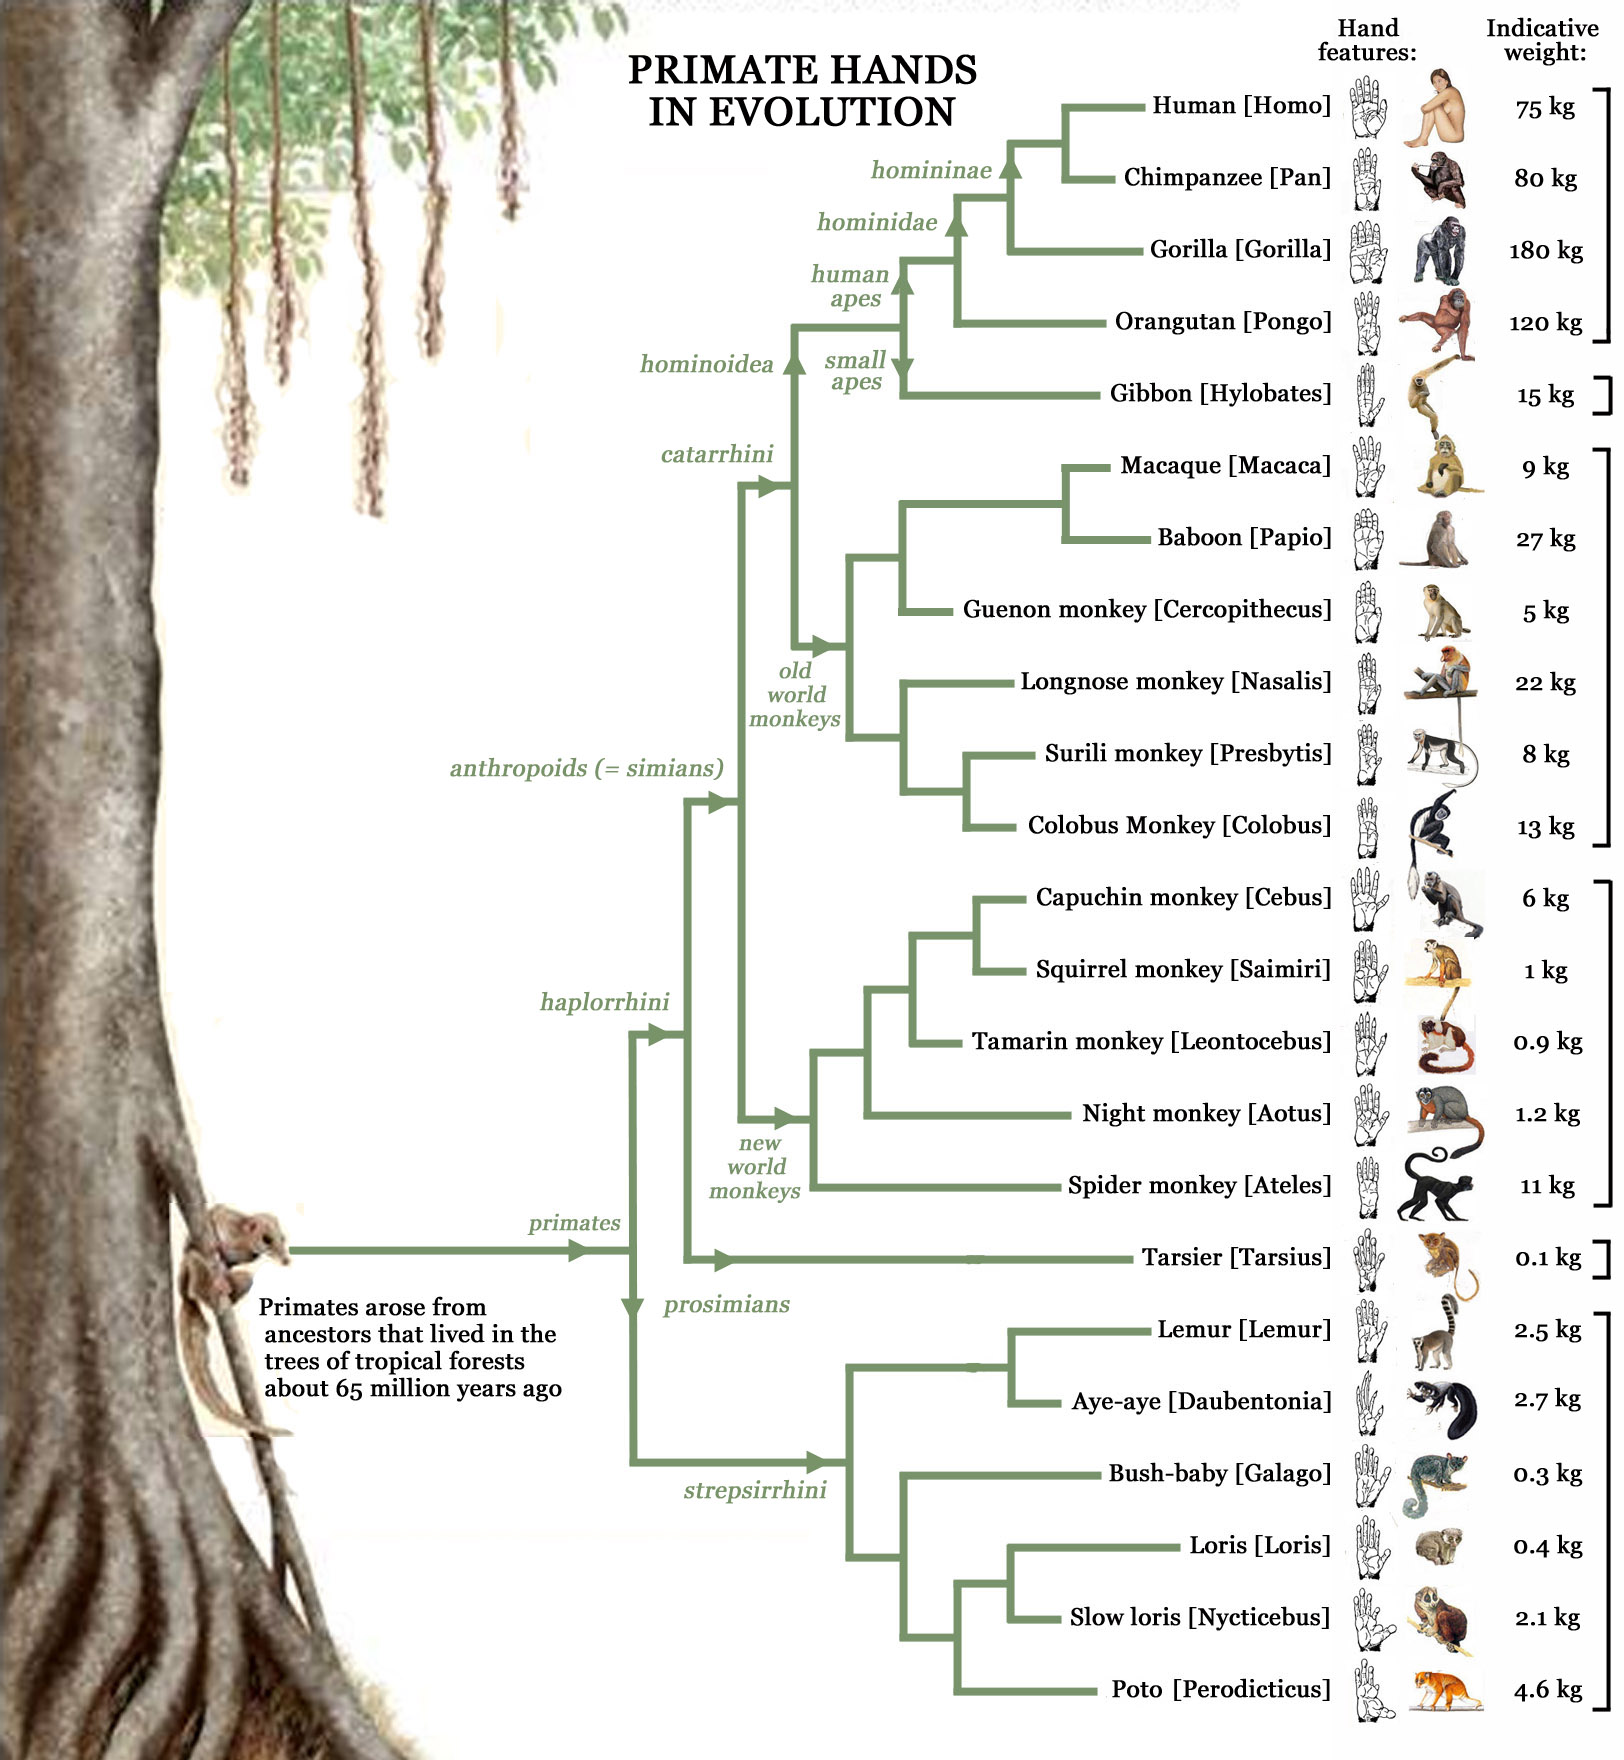
The primate hands in evolution grouped by primate sub-family (drawn hands inside the
picture above origin from A. H. Schultz, The Life of Primates, Universe Books, 1969).
|
PRIMATE SPECIES |
Genetic distance to humans |
Finger length vs. Palm breadth ratio |
Finger length vs. Palm length ratio |
Palm breadth vs. Palm length ratio |
Digit Formula |
2D:4D ratio |
|
| _Human apes: | |||||||
|
Humans |
- |
0.980 |
0.764 |
0.781 |
3D>4D>2D>1D>5D |
0.96 |
|
| _Non-human apes: | |||||||
| Bonobos | 0.017% | 1.05 | 0.71 | 0.67 | 3D>4D>2D>5D>1D | 0.94 | |
| Chimpanzees | 0.016% | 1.128 | 0.688 | 0.610 | 3D>4D>2D>5D>1D | 0.91 | |
| Gorillas | 0.019% | 0.662 | 0.549 | 0.879 | 3D>4D>2D>5D>1D | 0.89 | |
| Orangutans | 0.031% | 1.116 | 0.571 | 0.512 | 3D>4D>2D>5D>1D | 0.89 | |
| Gibbons | 0.042% | 1.909 | 0.940 | 0.493 | 3D>2D>4D>5D>1D | 1.03 | |
| _Old World Monkeys: | |||||||
| Macaques | 0.061% | 1.174 | 0.740 | 0.630 | 3D>4D>2D>5D>1D | 0.85 | |
| Baboons | 0.066% | 0.846 | 0.579 | 0.684 | 3D>4D>2D>5D>1D | 0.86 | |
| Guenon monkeys | 0.063% | 1.163 | 0.641 | 0.551 | 3D>4D>2D>5D>1D | 0.86 | |
| Longnose monkeys | 0.072% | 1.500 | 0.761 | 0.507 | 3D>4D>2D>5D>1D | 0.83 | |
| Surili monkeys | 0.071% | 1.184 | 0.577 | 0.487 | 3D>4D>2D>5D>1D | 0.80 | |
| Colobus monkeys | 0.072% | 1.459 | 0.730 | 0.514 | 3D>4D>2D>5D>1D | 0.65 | |
| _New World Monkeys: | |||||||
| Capuchin monkeys | 0.123% | 1.140 | 0.814 | 0.714 | 3D>2D>4D>5D>1D | 1.09 | |
| Squirrel monkeys | ? | 1.140 | 0.864 | 0.758 | 3D>4D>2D>5D>1D | 0.93 | |
| Tamarin monkeys | ? | 1.238 | 0.722 | 0.583 | 3D>4D>2D>5D>1D | 0.94 | |
| Night monkeys | ? | 1,146 | 0.786 | 0.686 | 3D>4D>2D>5D>1D | 0.84 | |
| Spider monkeys | ? | 1.325 | 0.693 | 0.533 | 3D>4D>2D>5D>1D | 0.83 | |
| _Prosimians: | |||||||
| Tarsiers | 24.8% | 2.080 | 1.531 | 0.745 | 3D>2D>4D>5D>1D | 1.02 | |
| _Non tarsier prosimians: | |||||||
| Lemurs | 22.1% | 1.444 | 0.813 | 0.563 | 4D>3D>5D>2D>1D | 0.74 | |
| Aye-ayes | ? | 2.111 | 1.583 | 0.750 | 4D>3D>5D>2D>1D | 0.63 | |
| Bush babies | 28.1% | 1.500 | 1.154 | 0.769 | 4D>3D>5D>2D>1D | 0.66 | |
| Lorises | ? | 1.500 | 1,071 | 0.714 | 4D>3D>5D>1D>2D | 0.60 | |
| Slow lorises | ? | 1.300 | 0.813 | 0.625 | 4D>3D>5D>1D>2D | 0.45 | |
| Potos | ? | 1.300 | 0.765 | 0.588 | 4D>3D>5D>1D>2D | 0.20 |
|
The data in the table above shows how next to hand shape also finger length (digit) distribution provide a sign of evolution.
The digit formula shows how the role of the pinky finger (5D) becomes less prominent while going up in primate evolution tree: in humans the pinky finger is usually the smallest of all 5 digits, while in prosimians the pinky is usually longer than the two fingers on the opposite side of the hand: the thumb and the index finger.
And the reversed tendency is seen in the middle finger (3D), which is usually the longest digit of all... except in the prosimian hand (non-tarsier) - where the ring finger is the longest digit.
Interestingly, a likewise tendency is seen in respective the ring finger (4D) and the index finger (2D) - where the 2D:4D digit ratio between these fingers tends to become higher while going up in the primate evolution tree. This likely implicates that the pinky (5D) & ring finger (4D)can be recognized to represent the more 'primitive' fingers, while the thumb (1D), index- (2D) and middle finger (3D) can be recognized to represent the more 'evolved' fingers (one can also speak of the more 'specialized' or more 'complex' fingers). The Youtube-video below presents a visualization of the evolution of hand shape and finger length distribution. |
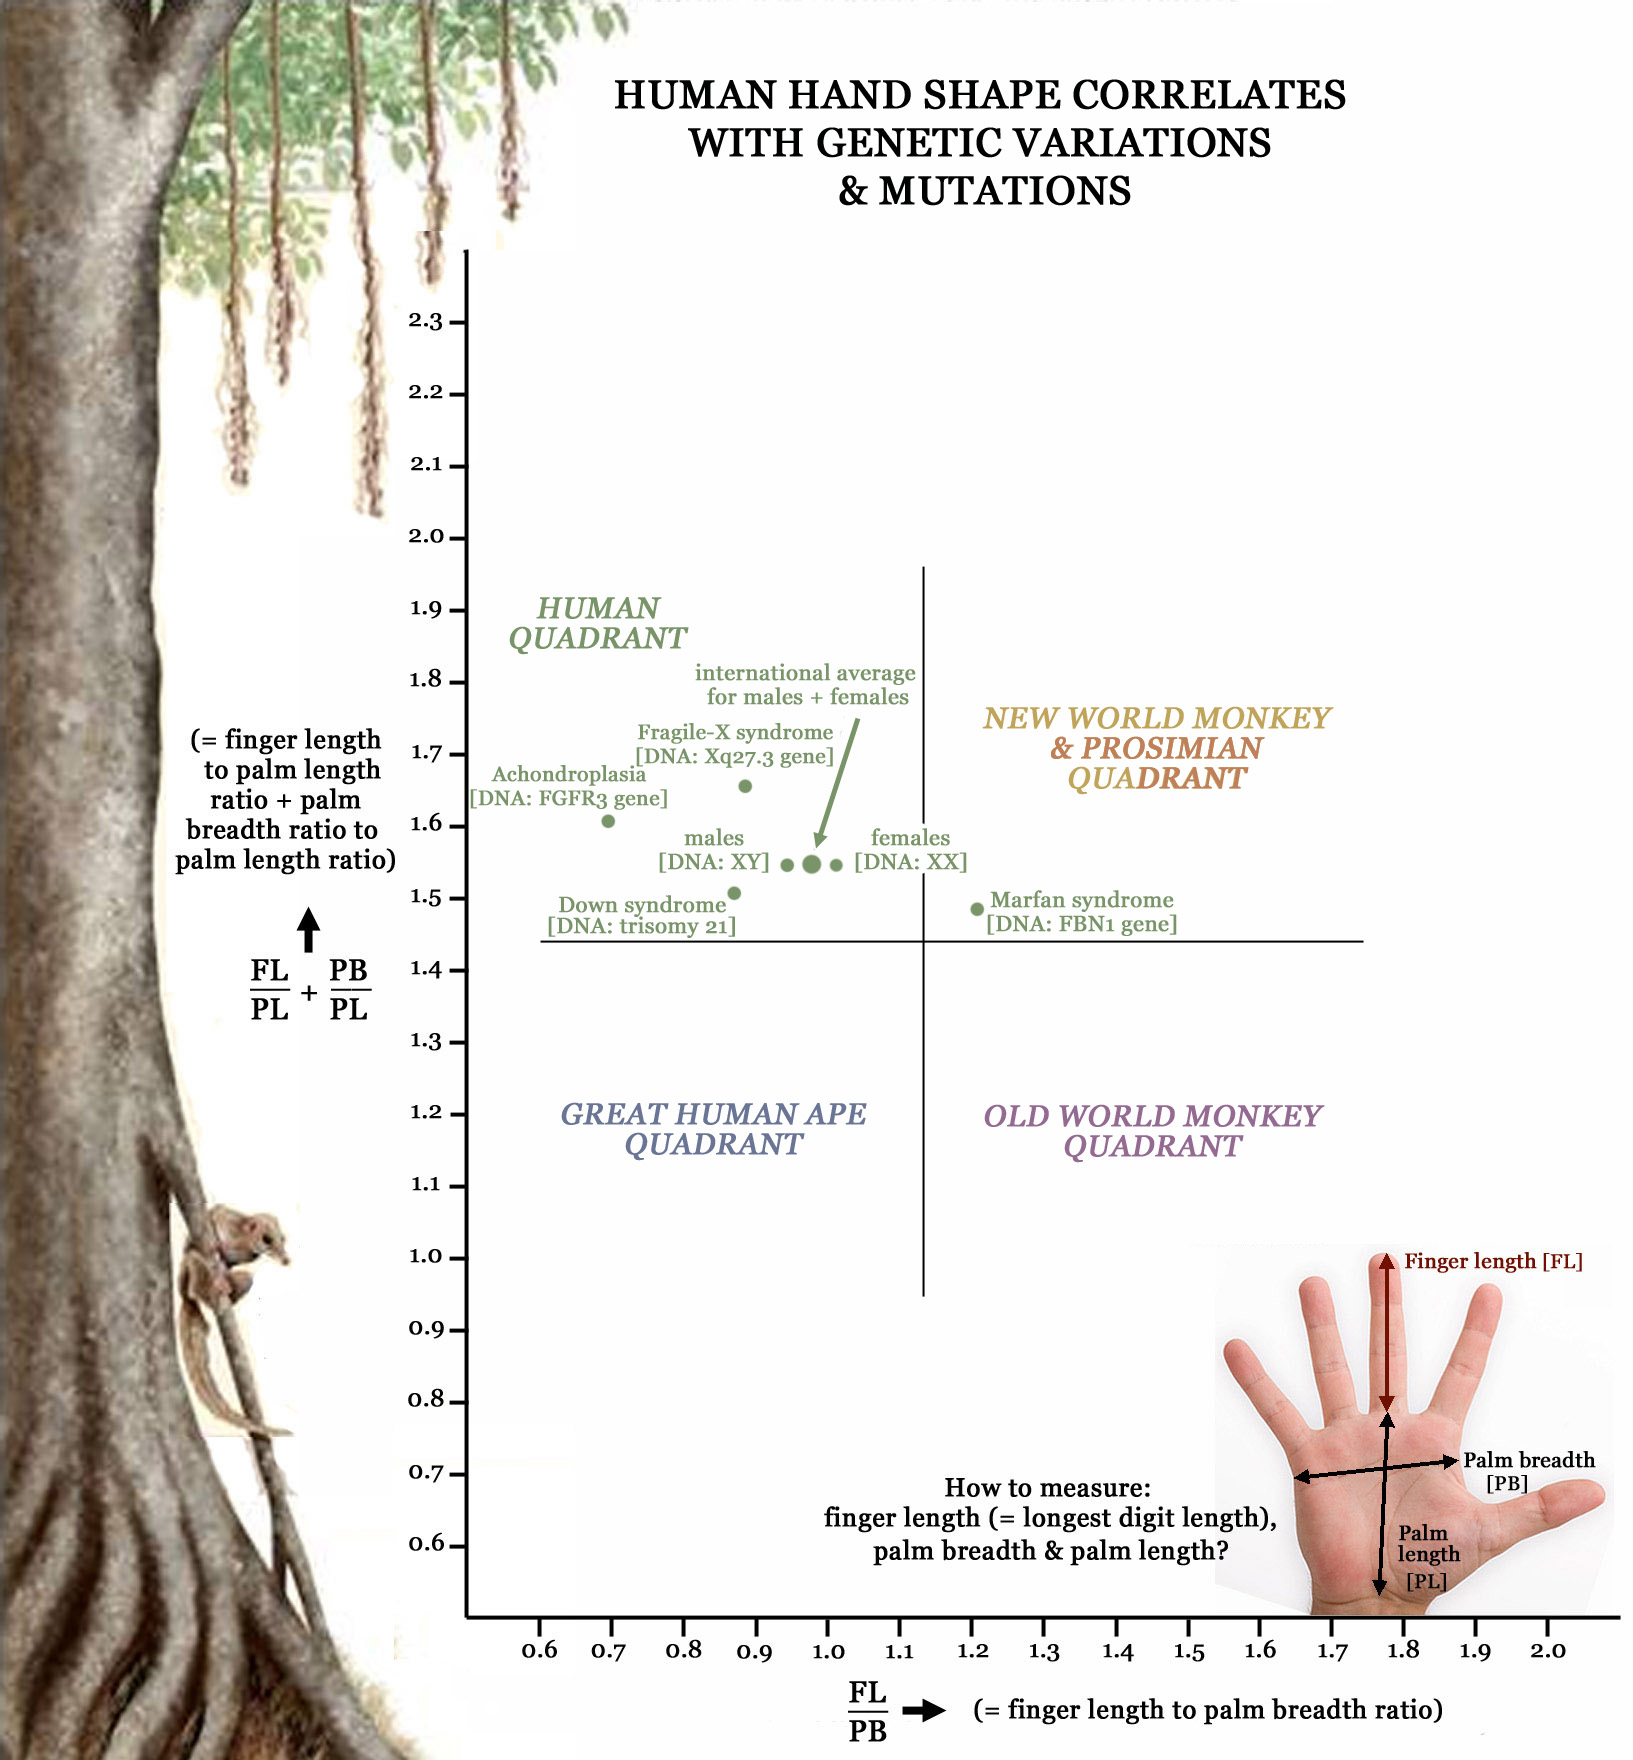
| But hand shape signals more than just the genetic distance (DNA) in the evolutionary perspective. Because hand shape provides also a clue regarding chromosomal- and genetic disorders, such as: Down syndrome, Fragile-X syndrome, achondroplasia & Marfan syndrome. The picture below presents an overview of some of the most common chromosomal- and gentic disorders. |
|
HUMAN SUB-POPULATION |
Genetic peculiarity |
Finger length vs. Palm breadth ratio |
Finger length vs. Palm length ratio |
Palm breadth vs. Palm length ratio |
Digit Formula |
2D:4D ratio |
|
|
Human average |
normal |
0.98 |
0.76 |
0.78 |
3D>4D>2D>1D>5D |
0.96 |
|
| _Genetic sub-population: | |||||||
| Males | XY | 0.95 | 0.75 | 0.79 | 3D>4D>2D>1D>5D | 0.95 | |
| Females | XX | 1.01 | 0.77 | 0.77 | 3D>4D>2D>1D>5D | 0.97 | |
| Achondroplasia | FGFR3 gene | 0.70 | 0.66 | 0.95 | 3D>4D>2D>1D>5D | 0.96 | |
| Down syndrome | Trisomy 21 | 0.87 | 0.70 | 0.81 | 3D>4D>2D>1D>5D | 0.96 | |
| Fragile-X syndrome | Xq27.3 gene | 0.89 | 0.78 | 0.88 | 3D>4D>2D>1D>5D | 0.96 | |
| Marfan syndrome | FBN1 gene | 1.21 | 0.81 | 0.67 | 3D>4D>2D>1D>5D | 0.96 |
|
|
|
|
© COPYRIGHT 2002-2017: |