|
FEBRUARY 12, 2017
|
|
|
FEBRUARY 12, 2017
|
|
|
This article presents new materials describing how the 'hand index' can be sub-divided into two hand breadth [PB] ratios, based on on palm shape (PB/PL) and palm breadth vs. finger length (PB/FL). An analysis including 19 human populations & 23 primate populations reveals that these hand breadth measures are highly sensitive for discriminating these populations from each other. The results also suggest that palm length [PL], finger length [FL] and digit ratio [2D:4D] appear about half less sensitive for this purpose.
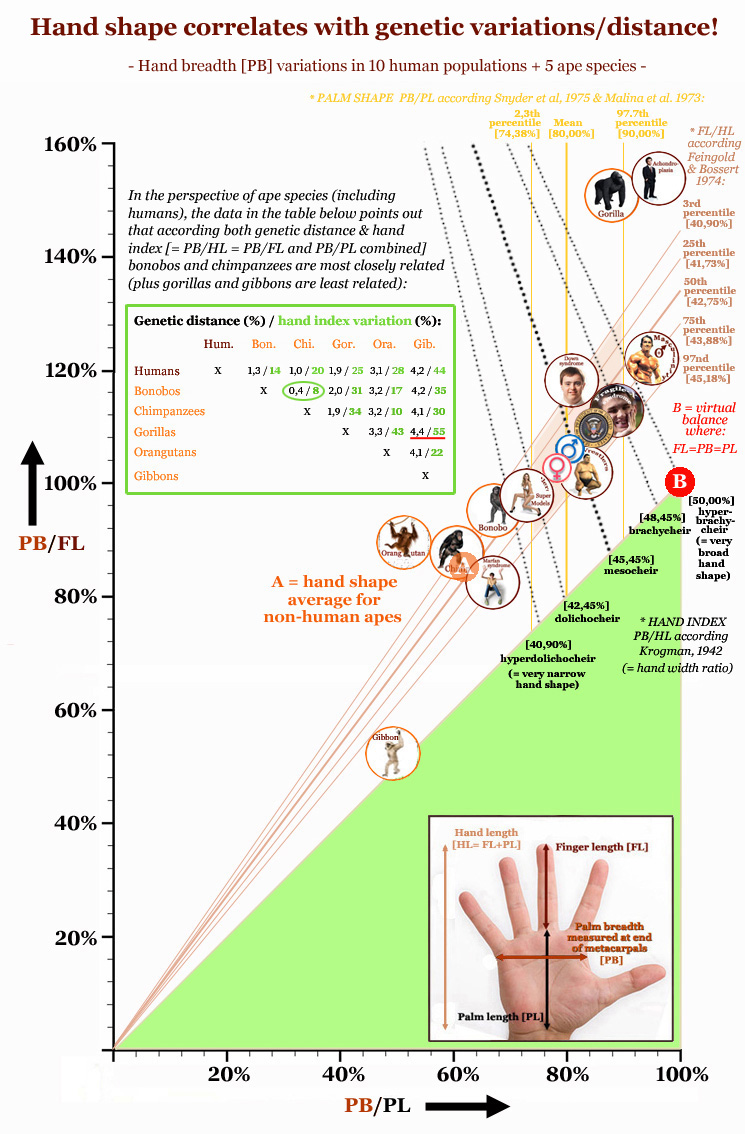
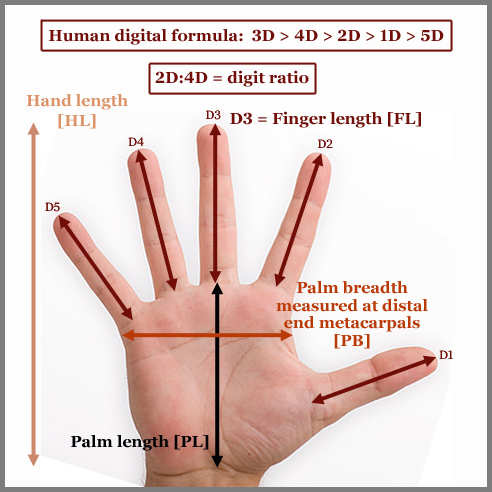
The continuation of this article first presents a picture describing how the 'hand index' correlates with genetic distance between primate species - NOTICE: the green table inside the picture e.g. describes how both the genetic distance and the 'hand index' is relatively small between chimpanzees and bonobos (+ relatively large between gorillas and gibbons). The picture also presents a visual impression of the variation in the 2 aspects of the 'hand index': the finger-aspect [PB/FL] & the palm-aspect [PB/PL]; the proportions for virtual balance are also displayed inside the picture. Then a video is presented displaying how the proportions of the hand have evolved during evolution from a low 'hand index' (featured with e.g. a short thumb & low 2D:4D digit ratio) into a high 'hand index' with the typical 'human digital formula' (featured with a long thumb & high 2D:4D digit ratio). Finally, a table is presented describing proportional data (involving hand shape- & finger proportions) for 19 human populations + 23 primate populations. The article is finished with a quick summary of strongest tendencies among 19 human populations for 5 proportional hand factors. |
|
PRIMATE SPECIES |
Genetic distance |
PB/HL |
PB/PL |
PB/FL |
FL/HL |
FL/PL |
Digit Formula |
2D:4D ratio |
|
| Virtual balance: |
- |
0.5 |
1.0 |
1.0 |
0.5 |
1.0 |
3D>4D=2D>1D>5D |
1.0 |
|
|
Reference values: |
- |
0.455 +0,03/-0,03 |
0.80 +0,04/-0,04 |
1.04 +0,05/-0,05 |
0.432 +0,03/-0,03 |
0.76 +0,04/-0,04 |
3D>4D>2D>1D>5D |
0.96 +0,05/-0,05 |
|
| Human avg. est.: |
0% |
0.453 |
0.797 |
1.046 |
0.433 |
0.762 |
3D>4D>2D>1D>5D |
0.967 |
|
|
_Human international _populations: |
|
|
|||||||
| Malaysia (1) | (max. 0,5%) | 0.515 | 0.875 | 1.258 | 0.410 | 0.696 | 3D>2D>4D>1D>5D | 1.005 | |
| Korea (1,2) | (max. 0,5%) | 0.466 | 0.811 | 1.076 | 0.433 | 0.754 | 3D>4D>2D>1D>5D | 0.950 | |
| India (1,2) | (max. 0,5%) | 0.460 | 0.814 | 1.055 | 0.436 | 0.772 | 3D>4D>2D>1D>5D | 0.972 | |
| Australia (1,2) | (max. 0,5%) | 0.456 | 0.799 | 1.060 | 0.430 | 0.752 | 3D>4D>2D>1D>5D | 0.986 | |
| Netherlands (1,2) | (max. 0,5%) | 0.455 | 0.797 | 1.058 | 0.430 | 0.753 | 3D>4D>2D>1D>5D | 0.987 | |
| US (1,2,3) | (max. 0,5%) | 0.454 | 0.805 | 1.037 | 0.437 | 0.776 | 3D>4D>2D>1D>5D | 0.991 | |
| Turkey (1,2) | (max. 0,5%) | 0.444 | 0.781 | 1.031 | 0.431 | 0.757 | 3D>4D>2D>1D>5D | 0.993 | |
| China (1,2) | (max. 0,5%) | 0.438 | 0.773 | 1.004 | 0.436 | 0.769 | 3D>4D>2D>1D>5D | 0.933 | |
| Japan (1,2) | (max. 0,5%) | 0.428 | 0.758 | 0.982 | 0.436 | 0.772 | 3D>4D>2D>1D>5D | 0.953 | |
|
_Human professional _populations: |
|
|
|||||||
| Masculine men | (max. 0,5%) | 0.534 | 0.951 | 1.220 | 0.438 | 0.780 | 3D>4D>2D>1D>5D | 0.929 | |
| US presidents | (max. 0,5%) | 0.476 | 0.840 | 1.100 | 0.433 | 0.763 | 3D>4D>2D>1D>5D | 0.949 | |
| Sumo wrestlers | (max. 0,5%) | 0.456 | 0.832 | 1.008 | 0.452 | 0.825 | 3D>4D>2D>1D>5D | 0.942 | |
| Supermodels | (max. 0,5%) | 0.417 | 0.734 | 0,966 | 0.432 | 0.760 | 3D>4D>2D>1D>5D | 0.959 | |
|
_Human genetic _populations: |
|
|
|||||||
| Males | XY | 0.459 | 0.806 | 1.066 | 0.431 | 0.756 | 3D>4D>2D>1D>5D | 0.962 | |
| Females | XX | 0.445 | 0.787 | 1.027 | 0.434 | 0.768 | 3D>4D>2D>1D>5D | 0.971 | |
| Achondroplasia | FGFR3 gene | 0.572 | 0.95 | 1.429 | 0.398 | 0.66 | 3D>4D>2D>1D>5D | 0.96 | |
| Fragile-X syndrome | Xq27.3 gene | 0.494 | 0.88 | 1.124 | 0.438 | 0.78 | 3D>4D>2D>1D>5D | 0.95 | |
| Down syndrome | Trisomy 21 | 0.476 | 0.81 | 1.149 | 0.412 | 0.70 | 3D>4D>2D>1D>5D | 0.95 | |
| Marfan syndrome | FBN1 gene | 0.370 | 0.67 | 0.826 | 0.448 | 0.81 | 3D>4D>2D>1D>5D | 0.96 | |
|
_Non-human apes _[average]: |
[0.380] |
[0.6333] |
[0.853] |
[0.405] |
[0.692] |
[3D>4D>2D>5D>1D] |
[0.932] |
||
| Gorillas | 1,9% | 0.567 | 0.879 | 1.511 | 0.354 | 0.549 | 3D>4D>2D>5D>1D | 0.89 | |
| Bonobos | 1,3% | 0.392 | 0.67 | 0.952 | 0.415 | 0.71 | 3D>4D>2D>5D>1D | 0.94 | |
| Chimpanzees | 1,0% | 0.361 | 0.610 | 0.887 | 0.408 | 0.688 | 3D>4D>2D>5D>1D | 0.91 | |
| Orangutans | 3,1% | 0.326 | 0.512 | 0,896 | 0.363 | 0.571 | 3D>4D>2D>5D>1D | 0.89 | |
| Gibbons | 4,2% | 0.254 | 0.493 | 0.524 | 0.485 | 0.940 | 3D>2D>4D>5D>1D | 1.03 | |
|
_Old World Monkeys _[average]: |
[0.338] |
[0.562] |
[0.819] |
[0.401] |
[0.671] |
[3D>4D>2D>5D>1D] |
[0.808] |
||
| Baboons | 6,6% | 0.433 | 0.684 | 1.182 | 0.367 | 0.579 | 3D>4D>2D>5D>1D | 0.86 | |
| Macaques | 6,1% | 0.362 | 0.630 | 0.852 | 0.425 | 0.740 | 3D>4D>2D>5D>1D | 0.85 | |
| Guenon monkeys | 6,3% | 0.336 | 0.551 | 0.860 | 0.391 | 0.641 | 3D>4D>2D>5D>1D | 0.86 | |
| Surili monkeys | 7,1% | 0.309 | 0.487 | 0.845 | 0.366 | 0.577 | 3D>4D>2D>5D>1D | 0.80 | |
| Colobus monkeys | 7,2% | 0.297 | 0.514 | 0.685 | 0.422 | 0.730 | 3D>4D>2D>5D>1D | 0.65 | |
| Longnose monkey | 7,2% | 0.288 | 0.507 | 0.667 | 0.432 | 0.761 | 3D>4D>2D>5D>1D | 0.83 | |
|
_New World Monkeys _[average]: |
[0.370] |
[0.655] |
[0.835] |
[0.436] |
[0.776] |
[3D>4D>2D>5D>1D] |
[0.926] |
||
| Squirrel monkeys | ? | 0.418 | 0.758 | 0.877 | 0.464 | 0.864 | 3D>4D>2D>5D>1D | 0.93 | |
| Capuchin monkey | 12,3% | 0.394 | 0.714 | 0.877 | 0.449 | 0.814 | 3D>2D>4D>5D>1D | 1.09 | |
| Night monkeys | ? | 0.384 | 0.686 | 0.873 | 0.440 | 0.786 | 3D>4D>2D>5D>1D | 0.84 | |
| Tamarin monkeys | ? | 0.339 | 0.583 | 0.808 | 0.419 | 0.722 | 3D>4D>2D>5D>1D | 0.94 | |
| Spider monkeys | ? | 0.315 | 0.533 | 0.755 | 0.409 | 0.693 | 3D>4D>2D>5D>1D | 0.83 | |
|
_Prosimians: |
|||||||||
| Tarsiers | 24,8% | 0.294 | 0.745 | 0.481 | 0.605 | 1.531 | 3D>2D>4D>5D>1D | 1.02 | |
|
_Non tarsier prosimians _[average]: |
[0.330] |
[0.668] |
[0.655] |
[0.483] |
[1.033] |
[4D>3D>5D>2D>1D] |
[0.547] |
||
| Bush babies | 28,1% | 0.357 | 0.769 | 0.667 | 0.536 | 1.154 | 4D>3D>5D>2D>1D | 0.66 | |
| Lorises | ? | 0.345 | 0.714 | 0.667 | 0.517 | 1,071 | 4D>3D>5D>2D>1D | 0.60 | |
| Slow lorises | ? | 0.345 | 0.625 | 0.769 | 0.348 | 0.813 | 4D>3D>5D>1D>2D | 0.45 | |
| Potos | ? | 0.333 | 0.588 | 0.769 | 0.433 | 0.765 | 4D>3D>5D>1D>2D | 0.20 | |
| Lemurs | 22,1% | 0.311 | 0.563 | 0.693 | 0.448 | 0.813 | 4D>3D>5D>2D>1D | 0.74 | |
| Aye-ayes | ? | 0.290 | 0.750 | 0.474 | 0.613 | 1.583 | 4D>3D>5D>2D>1D | 0.63 |
|
PRIMATE SPECIES |
PB/HL |
PB/PL |
PB/FL |
FL/HL |
FL/PL |
Digit Formula |
2D:4D ratio |
||
|
Discriminative indicators amount: |
|
4x 23x |
6x 24x |
8x 24x |
6x 7x |
11x 11x |
10x 22x |
3x 17x |
|
among 19 human populations: • PB/HL (= hand index: palm breadth vs. hand length): - high PB/HL values [> 0.485] in: masculine males, achondroplasia, Malaysians; - low PB/HL values [< 0.425] in: Marfan syndrome & supermodels (likely slender constitution). • PB/PL (= 1st aspect of hand index: palm shape index): - high PB/PL values [> 0.84] in: masculine males, achondroplasia, Malaysians, fragile-x syndrome, US presidents; - low PB/PL values [< 0.76] in: Marfan syndrome, supermodels, Japanese (likely slender constitution). • PB/FL (= 2nd aspect of hand index: palm breadth vs. finger length): - high PB/FL values [> 1.09] in: achondroplasia, Malaysians, masculine males, Down syndrome, fragile-x syndrome, US presidents; - low PB/FL values [< 0.99] in: Marfan syndrome, supermodels, Japanese (likely slender constitution). • FL/HL (= finger index): - high FL/HL values [> 0.462] in: (no populations identified); - low FL/HL values [< 0.402] in: achondroplasia. • FL/PL (= finger length to palm length ratio): - high FL/PL values [> 0.80] in: Sumo wrestlers & Marfan syndrome (likely long limbs); - low FL/PL values [< 0.72] in: achondroplasia, Down syndrome & Malaysians (likely short limbs). • 2D:4D (= digit ratio): - high FL/HL values [> 1.00] in: (no populations identified); - low FL/HL values [< 0.92] in: (no populations identified). NOTICE: The hand research Big Five personality project has so far also confirmed the relatively high sensentivity regarding the 'hand breadth' factor: e.g. hand index [PB/HL] has been reported to correlate negative with Conscientiousness and the 2nd aspect of the hand index [PB/FL] has been reported to correlate possitive with Extraversion. Additionally, only a small significant effect has been reported for the 2d:4d digit ratio (combined with overall hand shape) regarding Extraversion. More details available here: Hand Shape Assessment 2.0 (Finger length proportions also do appear to play a small part in the Big Five dimension Altruïsm, more details will follow in the future) PB/HL = Hand Index (= palm breadth/hand length) FL/HL = Finger Index (= finger length/hand length) FL/PB = finger length / palm breadth FL/PL = finger length / palm length PB/PL = palm breadth / palm length Digit formula: 1D = Thumb | 2D = Index finger | 3D = Middle finger | 4D = Ring finger | 5D = Pinky finger 2D:4D = digit ratio (= Index finger/Ring finger) |
|
- Primate hand drawings from A. H. Schultz, The Life of Primates (Universe Books, 1969) - 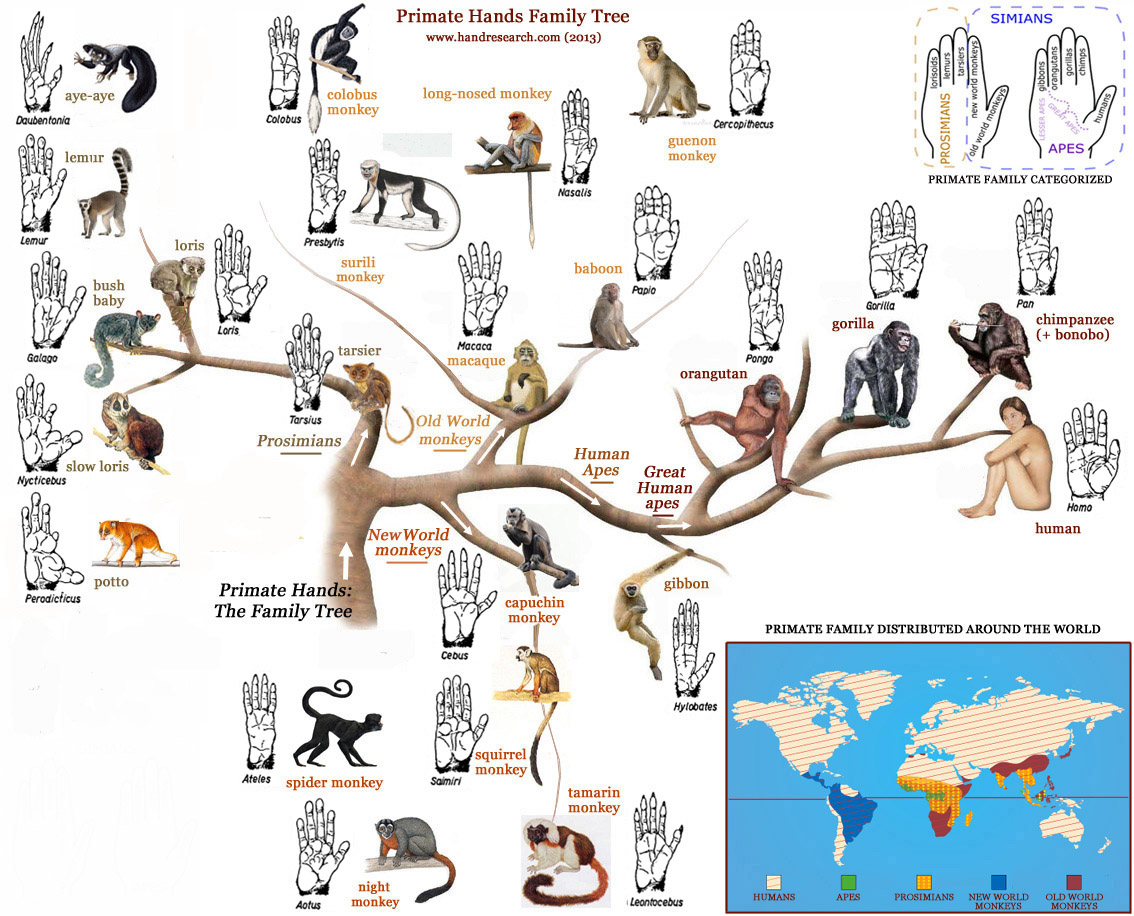
|
|
|
|
|
© COPYRIGHT 2002-2017: |