|
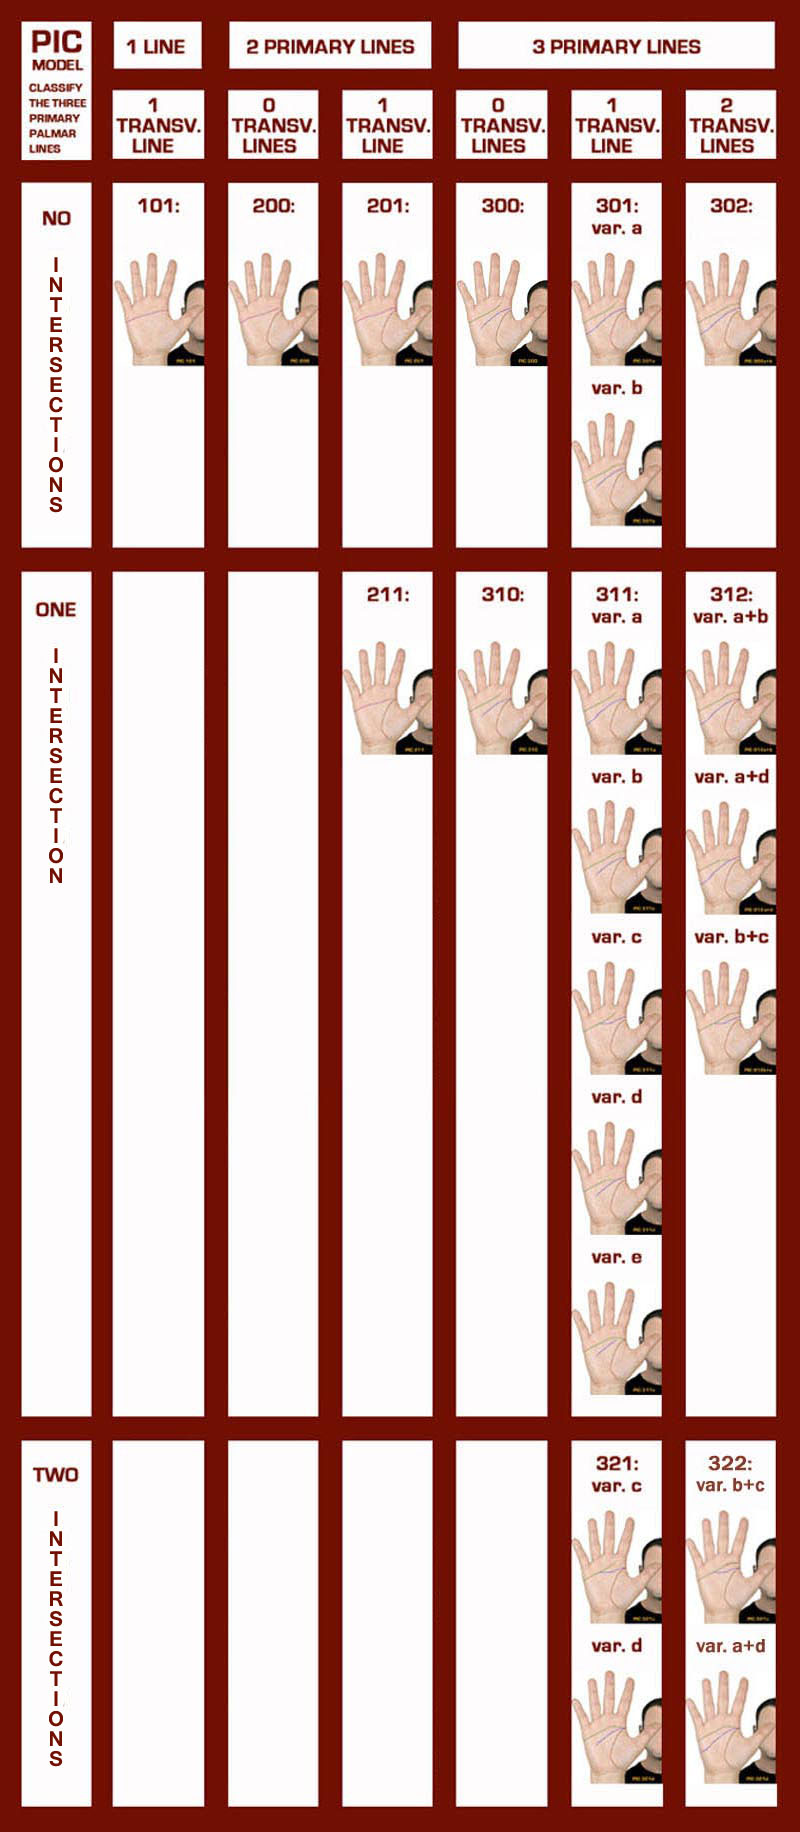
WHAT CAN FORMATIONS IN HAND LINES REVEAL? VARIOUS 'PIC MODEL' STUDIES: MALES - FEMALES, DOWN SYNDROME, INTELLIGENCE (IQ), AUTISM, BIG FIVE PERSONALITIES, DYSLEXIA... + MORE! The 'PIC model' concerns an innovative classification model to describe the basic characteristics of the 3 primary hand lines in the palm of any hand. The purpose of the model is to describe the significance of various hand line types [life line, heart line & head line] in various populations. First, we will see how the 21 PIC-types manifests in the general population, including the most significant differences between the hand lines of men and women. Second, we will study the significance of relatively normal hand line types in highly intelligent people (university students); and the significance of line variants which are recognized as a 'minor physical anomaly' in populations characterized by impaired intelligence (S.E.N. pupils & Down syndrome patients). Third, the hand lines of some other specific populations will be studies - including e.g: autism, dyslexia and the Big Five personality dimensions. INCLUDING: NOTICE: All results available so far are displayed in the 3 tables at the bottom of this page (table 1: males + females, table 2: males & table 3: females) - more info will become available in the near future. in the general population! A study of the major 3 hand lines in a Dutch population (see table 1: N=400, including: 200 males + 200 females) has resulted in 6 important conclusions: The result e.g. indicate that the hands of a large majority of people can be described with only two 'PIC model' hand line types: >> CONCLUSION I-1: 'PIC type 310' was observed in 60.0% of all hands; this concerns by far the most common hand line variant (46.0% of the studied people have 'PIC type 310' in both hands). >>CONCLUSION I-2: 'PIC type 300' is the second most common hand line variant - observed in 21.25% of all hands (12.25% of studied people have 'PIC type 300' in both hands). And the hands of a considerable percentage of the studied people display the combination of 'PIC type 310' and 'PIC type 300'; 5.75% of the studied people have this combination in respective their left- (PIC type 301) and right hand (PIC type 300), while 4.75% have the reversed combination. In total 81.25% of all studied hands displayed one of both types (see table 1: 'PIC group A') - a strong indication that both types should be recognized as a relatively normal variants of the 3 primary hand lines.
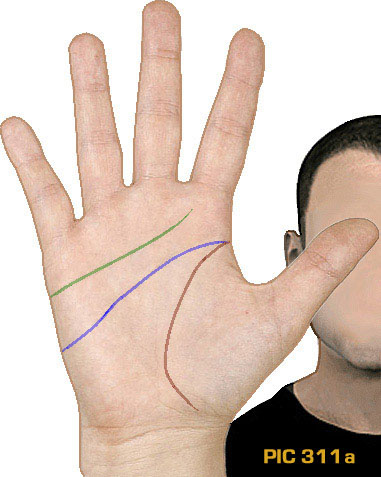
How common are the two 'minor physical anomalies' (simian line + Sydney line) in the studied general population? >> CONCLUSION I-3: The 'classic simian line' (see 'PIC type 211') - which can be recognized by a complete fusion of the heart line and head line, resulting in one single line that is usually connected with the life line - was observed in 1.12% of all studied hands (only 0.75% of the studied people displayed the classic 'simian line' in both hands). However, simian related variants were observed in 10.11% of all studied hands (see table: 'PIC group B+C+D')- the majority of these were classified as 'PIC type 321d', where all three primary lines get connected at the thumb side of the palm (often featured a large 'splitting' in the heart line, including: one branch connecting to the start of head line/life line, and the other branch directed towards the fingers). >> CONCLUSION I-4: The 'classic Sydney line' (see 'PIC type 311a') - which can be recognized by a full-palm transversing head line (typically connected to the life line) - was observed in 2.62% of all studied hands (only 0.25% of the studied people displayed the classic 'Sydney line' in both hands). However, Sydney related variants were observed in 6.37% of all studied hands (see table: 'PIC group E+F') - the majority were classified as 'PIC type 301a', which concerns the 'dissociated' variant of the Sydney line where the head line is not connected with the life line.
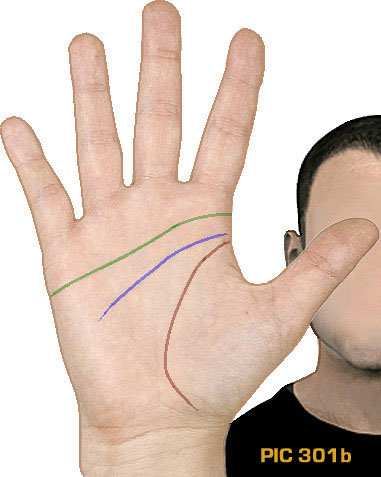
Next to the 'classic simian line' and 'classic Sydney line', is the 'complete transversal heart line' a third rather important hand line variant. >> CONCLUSION I-5: Nearly all cases 'complete transversal heart line' concerned the 'PIC type 311b' variant (observed in 2.87% of all studied hands); while 'PIC type 301b' (observed in 0.25% of all studied hands) can be described as belonging to the more rare hand line types.
Any other important conclusions? >> CONCLUSION I-6: Of all 21 types that are described in the 'PIC model', only four PIC types have not been observed in the Dutch population. This indicates that the following hand line variants can be described as extremely rare: 'PIC type 101', 'PIC type 312b+c', and 'PIC type 322b+c'; while 'PIC type 312a+b' has been observed once in another population (see paragraph 3: university students). NOTICE: In a Chinese biometry study (Xiangqiang Wu, et.al., 2004) was variant 'PIC type 101' observed in 0.36% of 13.800 hands; but one should evaluate this percentage in the perspective that international simian line studies indicate that the occurence of the 'classic simian line' is much higher in Asian populations (Asano reports: Chinese 13.0%, Dutch: 1.5%). So, it's not surprizing at all that 'PIC type 101' (which concerns a rare simian line variant) was not found at all in the Dutch population. in males vs. females! A comparison study of the major 3 hand lines in 200 Dutch males (see: table 2) versus 200 Dutch females (see: table 3), has resulted in four important conclusions: >> CONCLUSION II-1: All variants of a 'dissociated head line' are displayed about twice more often in the hands of females (37.75%) than in the hands of males (17.25%) - see table 2 & 3: PIC group I+J; and the most common dissociated variant, 'PIC type 300', was observed in both hands of: 16.5% of females, and 8.0% of males. How about the two 'minor physical anomalies', any sexe differences for the simian line + Sydney line? >> CONCLUSION II-2: 'Classic simian line variants' are more often seen in the hands of males (2.5%) than in the hands of females (0.25%) - see table 2 & 3: PIC group B; >> CONCLUSION II-3: 'Classic Sydney line variants' are more often seen in the hands of females (7.0%) than in the hands of males (4.0%) - see table 3 & 2: PIC group E; >> CONCLUSION II-4: In both males and females slightly more than 80% of all hands display the two most common hand line type variants ('PIC type 310' and 'PIC type 300' - see table 2 & 3: PIC group A); this implicates e.g. that while the 'simian line' is more frequently observed in the hands of men, the 'Sydney line' variants (see PIC group E+F: males 4.25% vs. females 8.75%) and the 'complete transversal heart line' variants (see PIC group G+H: males 2.75% vs. female 3.5%) are more often seen in the hands of women. This implicates that the 'PIC model' points out in both males and females less than 20% of all studied hands display one of more minor/major abnormalities in the core formation of the 3 primary palmar creases. In the studied population 30.5% of the men and 31.5% of the studied women have an abnormality in at least 1 hand. This implicates that in respective: 69.5% of men and 68.5% of women both hands display 'PIC type 300' and/or 'PIC type 310'. ADDITIONAL COMMENT: By the way... there is a fundamental connection between conclusion II-A and II-B! For illustration, R.S. Bali has pointed out in his work Anthropology of Crease Morphogenesis (p.324, 1994) that the occurence of the 'simian line' [Bali: single radial base crease] and 'dissociated head line' [Bali: triple radial base crease] show an "inverse relationship" for all ethnic populations. The present study demonstrates that the same "inverse relationship" is not only seen between males and females: see table 2 & 3; but also between all 4 populations that are presented in table 1, see: PIC group B+C+D vs. PIC group I+J!!!
 A PIC Model study on 120 Dutch university students (versus 400 Dutch controls) points out: symmetrical hand lines correlate with high intelligence - confirmed in males & females!! in university students! A comparison study of the major 3 hand lines in 120 Dutch university students (see: first column in table 1, 2 & 3) and the control group, has resulted in three important conclusions: >> CONCLUSION III-1: The largest effect is found in the occurence of 'left-right asymmetries'. The occurence of those asymmetries is lower in the university students population, and especially the occurence of MULTIPLE asymmetries is significantly lower: only 3.33% of the university students have multiple L-R asymmetries, while in the control sample (N=400) the percentage is almost twice as high: 6.0% (this trend is especially seen in the female populations). NOTICE: Multiple asymmetries are indicated when in 'family tree' of hand lines (see the picture below) the PIC type of the left hand is at least two steps away from the right hand PIC type - while connections are only possible by following two arrows in the 'family tree'. For example: when a the right hand displays the most common hand line variant (PIC 310) and a left hand displays a 'classic simian line' (PIC 211), then the implication is the presence of a 'three step PIC asymmetry'. PICTURE: A 'family tree' of the 3 major hand lines! 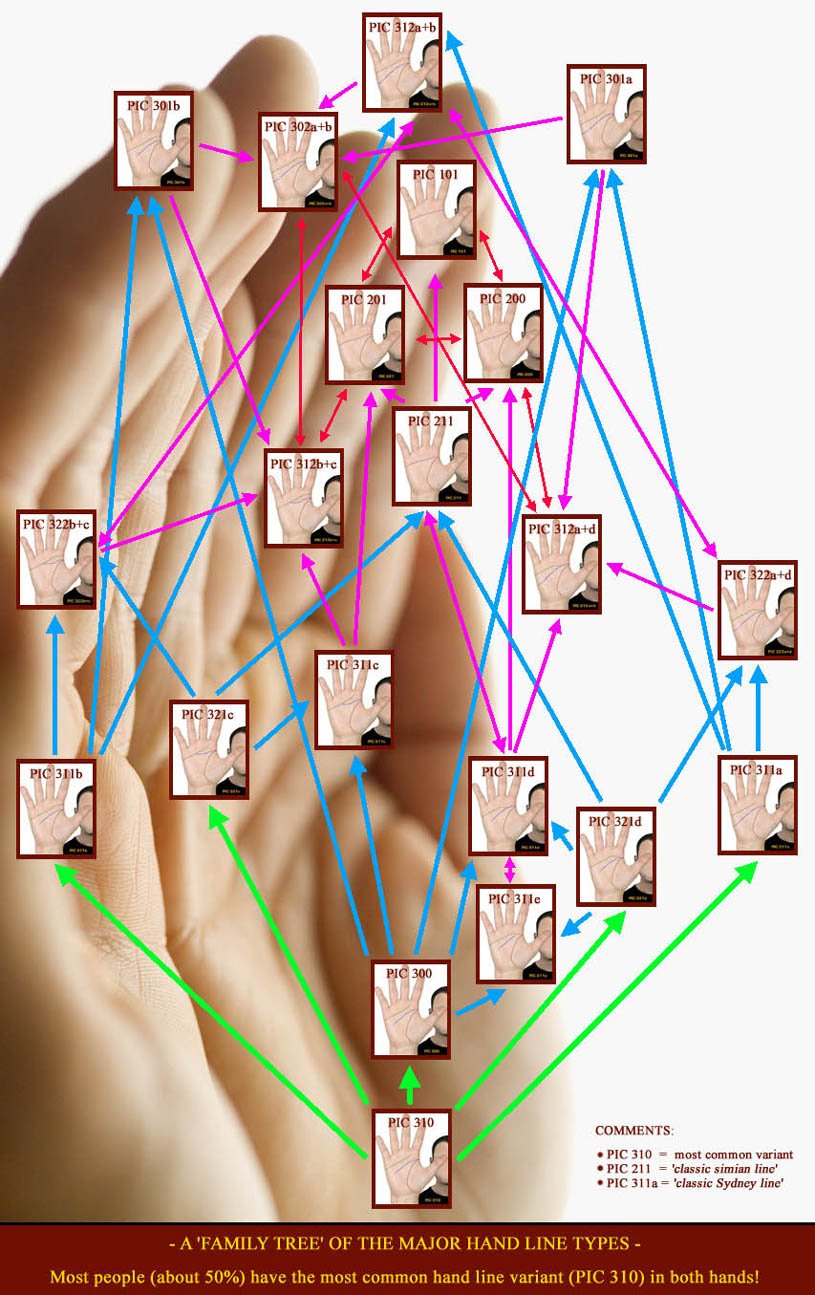
How about the two 'minor physical anomalies', how common are the simian line + Sydney line seen in the hands of the university students? >> CONCLUSION III-2: The 'classic simian line' and the 'classic Sydney line' are slightly less often seen in the university students, and the same trend is seen in far most related sub-types. But only for the Sydney line is this trend confirmed in both sexes. One can also notice from table 1 that the two most common hand line variants (PIC type 300 and PIC type 310) are slightly more common among the university students - when compared to the control population. Though table 2 and 3 reveal that only the most common type - 'PIC type 310' - is more often seen in both the male- AND female students. >> CONCLUSION III-3: Another interesting trend is the high occurence of the 'complete transversal heart line' variants - see table 1, PIC group G: 5.42% versus 3.12% in the control population. This trend is especially noticable in the studied males.
in S.E.N. pupils! S.E.N. pupils = children who have 'Special Education Needs' A study of the major 3 hand lines in 30 S.E.N. pupils (20 males and 10 females - see: third column in table 1, 2 & 3) has resulted in four important conclusions: >> CONCLUSION IV-1: A higher occurence of 'left-right multiple asymmetries' is noticed in S.E.N. pupils - see table 1: 10.0%, versus 6.0% in the control group. This trend has been noticed for both sexes. >> CONCLUSION IV-2: The two most normal PIC types (PIC type 310 and PIC type 300) are slightly less common seen in S.E.N. pupils (see table 1, group A: 78.33%, versus 81.25% in the control population). But only for 'PIC type 310' is this trend confirmed in both sexes. How about the two 'minor physical anomalies', how common are the simian line + Sydney line in the studied S.E.N. population? >> CONCLUSION IV-3: Two S.E.N. pupils have a PIC type 311a - the 'classic Sydney line' - in both hands (which is a relatively rare characteristic that has not been observed at all in the control group, nor the university students: see parage 1 and 3). And rather remarkable sexe-related pattern is noticed: - For, the occurence of the Sydney line variants in S.E.N. boys is about three-times higher compared to the control population (see table 2: PIC group E+F); - While the occurrence of the simian line variants in S.E.N. girls is about twice as high compared to the control population (see table 3: PIC group B+C+D). However, for the sexe where these MPA's are usually more common (Sydney line for females, simian line for males) the occurence is actually LOWER than in the control population!? (Though these 'reversed' trends could also be a coincidential result of the relatively small samples!) >> CONCLUSION IV-4: No 'complete transversal heart lines' at all! This trend is noticed in both sexes. in Down's syndrome! A study of the major 3 hand lines in 19 people who have Down's syndrome (12 males and 7 females - see: fourth column in table 1, 2 & 3) has resulted in seven important conclusions: >> CONCLUSION V-1: 'PIC type 310' and 'PIC type 300' are relatively uncommon in Down's syndrome (see table 1, group A: 28.95% in Down's syndrome versus 81.25% in the control population). For, more than 65% of the studied Down syndrome females + more than 75% of the studied Down syndrome males display a minor/major abnormality in the core formation of the 3 primary palmar lines - indicated by the relative absence of 'PIC type 310' and 'PIC type 300'. In the Dutch control population (N=400) this percentage is MUCH LOWER - in both males and females even slightly lower than 20%!! So, the 'PIC model' points out that - contrary to the general population - a large majority of people with Down's syndrome have abnormal hand lines!! How about the two 'minor physical anomalies', how common are the simian line + Sydney line in the studied Down's syndrome population? >> CONCLUSION V-2: The 'classic simian line' (PIC type 211) was observed in 21.0% of the studied Down syndrome hands; in 3 out of 19 Down syndrome subjects (2 males, 1 female) this pattern was observed in both hands (= 15.8%). While in the Dutch control population (N=400) only 3 males and no females at all (= 0.75% of the 400 studied men + women) have any of the 'classic simian crease variants' (= PIC group B) in both hands. This implicates that in the Down syndrome population any variant of the 'classic simian line' was found about 20x more often than in the general population! The most common 'simian line variant' (PIC type 321d) was observed in 23.68% of the studied Down syndrome hands - occurence is almost 5x higher than in the Dutch (control) population. >> CONCLUSION V-3: The 'classic Sydney line' (PIC type 311a) was observed in 18.42% of the studied Down syndrome hands - occurence is 7x higher than in the Dutch (control) population. And three Down's syndrome patients have a Sydney line variant in both hands (two of these individuals have the 'classic Sydney line' in both hands). Though the results are based on rather small Down syndrome samples for both sexes, the earlier described (see paragraph II) sexe differences appear also applicable to the hand in Down syndrome. For, in the studied population simian line related variants have a higher occurence in Down syndrome males than in Down syndrome females (see 'PIC group B+C+D': males 62.5% vs. females 35.71%). And the Sydney line related variants have a lower occurence in Down syndrome males than in Down syndrome females (see 'PIC group E+F': males 20.83% vs. females 35.71). Any other important conclusions? >> CONCLUSION V-4: The hand in Down syndrome is also featured with a relatively LOW occurence of all 'dissociated head line variants' (PIC group I+J): only 1 out of the 38 Down syndrome hands (= 2.63%) displayed this characteristic - compared to 27.5% of the Dutch control population (N=400), see: PIC group I+J. >> CONCLUSION V-5: Left-hand-versus-right-hand asymmetries are much more common in Down syndrome (52.63%) than in the general control population (38.0%). >> CONCLUSION V-6: Asymmetries are relatively often seen in Down's syndrome. But especially the multiple left vs. right asymmetries are significantly more common in Down syndrome: 21.05%, versus only 6.0% in the general population. And one can notice that the size of this effect is only slightly less significant than the results for the Sydney line variants. >> CONCLUSION V-7: No 'complete transversal heart lines' at all! This trend is noticed in both sexes. ADDITIONAL COMMENT: These results confirm the most significant results that were described in earlier publications for the hand lines in Down's syndrome: high occurence of both the simian line and Sydney line. So, the 'PIC model' turns out to be an excellent tool for studying AND describing the unusual major hand line characteristics in populations! 'Phantom picture' of the hand in Down's syndrome - 27 typical characteristics: characteristic 1 and 2 refer to in respective the 'simian line' and the 'Sydney line'. 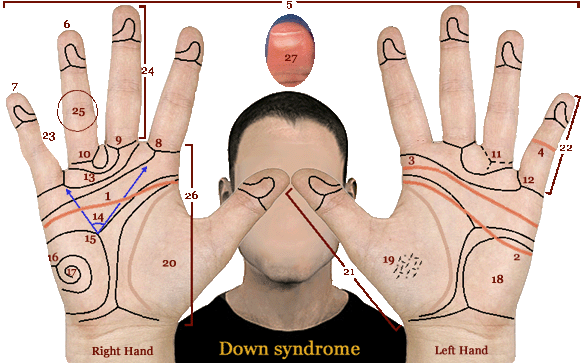
• Common hand line types in autism! • Common hand line types in dyslexia! • Common hand line types in Big Five personality dimensions!
|